Advancements in Dissolved Gas Analysis: Investigating Failure Cases

Introduction
Dissolved gas analysis (DGA) provides the early warning radar view of a transformer fleet with a non-intrusive screening process for early identification of problematic transformers. Suspicious transformers can be subjected to more invasive and costly physical testing to determine the actual condition and service readiness of the transformer. Three case histories illustrate the usefulness of recent innovations in transformer DGA, especially when there is gas loss. Two of the example transformers failed in service, to the surprise of the utilities responsible for them since they did not exceed conventional DGA limits. In the other case, the utility is urgently looking for a replacement unit based on very concerning DGA results. For these examples we will use some of the techniques presented earlier in this series of articles. We will also introduce some new concepts to be covered in greater detail in later articles of the series. For example, we will use cumulative gas data to compensate partially for gas loss. Gas loss occurs either by leakage or by gas blanket pressure regulation, which releases head space gas to reduce pressure and adds nitrogen to raise pressure. The IEEE C57.104 transformer DGA guide, from 1978 until the latest version in 2019
[1], has never adequately addressed the problem of gas loss, which can delay or prevent limits-based detection of fault gas production. We will also use normalized fault energy indices (NEI), which represent the energy required to generate the observed fault gases from the paper and oil insulation. This will illustrate a new paradigm for DGA interpretation, described briefly in Annex F of IEEE C57.104-2019, that is less focused on gas concentrations in favor of fault energy related to defects, malfunctions, and excessive stress. Rather than display long tables of numbers, we present the DGA data for the examples graphically in the form of three stacked charts for each example. The top chart is for the hydrocarbon gas fault energy index, NEI-HC, representing fault energy affecting the mineral oil. The upper trend line is cumulative NEI-HC, while the lower one is NEI-HC as calculated for each oil sample. Boxes are drawn on the cumulative NEI trend line to highlight time intervals when significant fault gas production appears to be happening. The middle chart is for the carbon oxide gas fault energy index, NEI-CO, representing fault energy affecting paper insulation in a similar fashion. The bottom chart is for the CO/CO2 gas concentration ratio as calculated for each oil sample.
Example #1
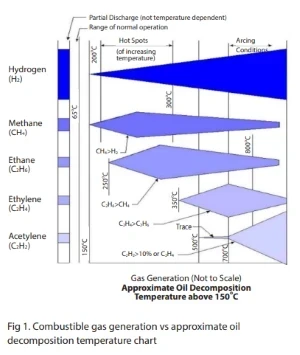
The transformer in Example #1 had a long NEI-CO gassing event, suggesting gradual thermal degradation of insulating paper. The up and down motion of NEI-CO (bottom line in the NEI-CO chart) is not just noise in the data – it reflects fault gas production with gas loss from pressure regulation connected with thermal cycling in a hot climate and a 6-month sampling frequency. The cumulative NEI-HC trend has two distinct gassing events with IEC fault types S and O respectively, indicating thermal fault gas production below 250°C.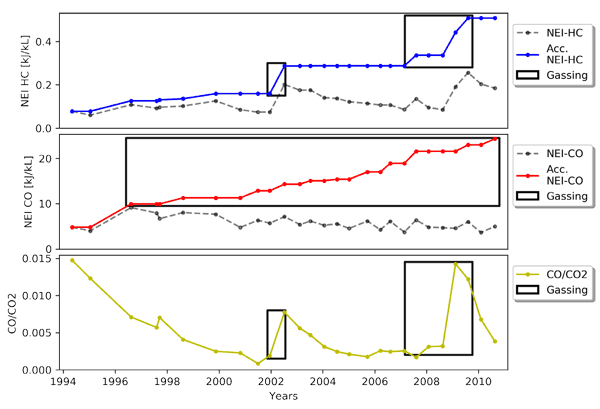
There are corresponding large increases in the CO/CO2 ratio, suggesting charring of winding paper insulation. The method of interpreting percent changes in the CO/CO2 carbon oxide gas ratio (sometimes inverted as CO2/CO) was worked out by Chris Rutledge and Randy Cox as a way of locating the source of carbon oxide gas production
[2, 3]. Large percent increases in CO/CO2 are associated with charring of winding insulation paper. Of course, degradation of winding insulation is of great interest. When this transformer tripped due to turn-to-turn arcing, it was a complete surprise to the utility. The transformer never exceeded IEEE C57.104-2008 gas concentration limits, nor did it exceed the IEEE C57.104-2019 rate of change limits. The Example #1 charts, providing evidence of continual paper degradation with two significant episodes of a low range thermal fault affecting winding insulation, would have led an experienced engineer to flag this unit for investigation. The concern would be heightened by the realization that the severity of the problem may have been underestimated due to gas loss. A post-mortem revealed extensive charring of the paper winding insulation.